

Quality Control in Manufacturing: Using Z-Tests to Monitor Production Standards
Every manufacturer faces the same challenge: how do you know your production line is making products that meet specifications? One defective batch can cost thousands or millions. Customer complaints damage your reputation. Recalls drain resources.
The answer lies in statistical quality control, and the z-test is one of the most practical tools for the job. It helps you spot problems before they become disasters, keeping your production standards consistent and your customers happy.
What Is Statistical Quality Control?
Statistical quality control uses math to monitor manufacturing processes. Instead of inspecting every single product, you take samples and analyze them. The goal is catching deviations from your target specifications before they spiral out of control.
Think about it this way: you're making thousands of widgets per day. Checking all of them is impossible and expensive. But if you randomly sample 50 widgets every hour and measure them, you can tell if something's going wrong.
Z-test calculators fit perfectly into this framework. They tell you whether your sample measurements differ significantly from your target values. If they do, you investigate and fix the problem. If they don't, you keep running.
This approach saves money, reduces waste, and maintains quality without slowing production.
Why Manufacturing Needs Z-Tests
Manufacturing processes naturally vary. Slight temperature changes, tool wear, material inconsistencies, and operator differences all create variation. Some variation is normal and acceptable. But too much variation means defective products.
Z-tests help you distinguish between normal variation and real problems.
They're fast. You can calculate a z-score in seconds and make decisions immediately.
They're objective. No guessing or gut feelings. The numbers tell you if something's wrong.
They're sensitive. Z-tests can detect small shifts in your process before they cause major issues.
They're standardized. Everyone on your team uses the same criteria for flagging problems.
Without statistical tools like z-tests, you're flying blind. You might catch obvious problems, but subtle shifts slip through until customers start complaining.
Understanding Control Charts
Control charts are the visual representation of z-tests in action. They plot your sample measurements over time with control limits that show acceptable ranges.
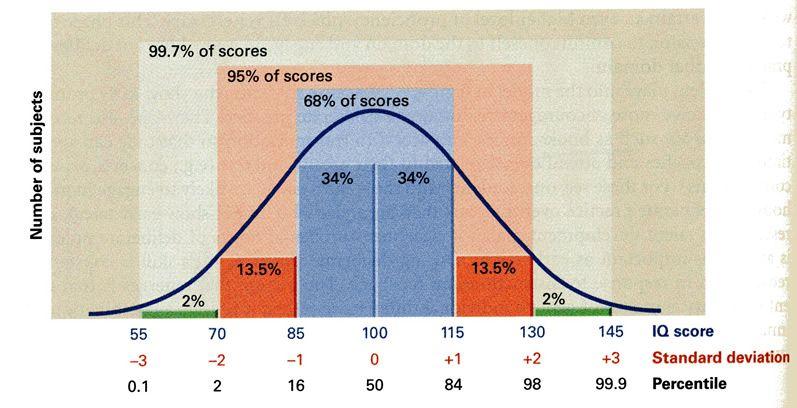
The center line represents your target value. Upper and lower control limits (usually set at 3 standard deviations from the target) show when measurements fall outside normal variation.
Here's how it works: every hour, you sample products and calculate their average measurement. Plot that average on your chart. If it falls between the control limits, everything's fine. If it crosses a limit, you investigate.
Control limits are essentially z-scores in disguise. Three standard deviations correspond to a z-score of 3, which means there's less than a 0.3% chance of seeing that result by random variation alone.
Most control charts use 3-sigma limits because they balance catching real problems with avoiding false alarms. Tighter limits (2-sigma) catch problems earlier but trigger more false alarms. Wider limits (4-sigma) reduce false alarms but might miss smaller issues.
Setting Up Z-Tests for Quality Control
Before you can use z-tests effectively, you need baseline data about your process.
Establish your target value. This comes from your product specifications. If you're making bolts that should be 50mm long, that's your target.
Determine normal variation. Run your process under ideal conditions and measure many samples. Calculate the standard deviation. This tells you how much natural variation exists.
Set your control limits. Using your standard deviation, calculate limits at 3 standard deviations above and below your target. These become your action thresholds.
Decide on sample size and frequency. Larger samples give more reliable results but cost more time. More frequent sampling catches problems sooner but requires more resources. Balance precision against practicality.
Train your team. Everyone needs to understand what measurements to take, how often, and what to do when limits are exceeded.
Getting this setup right matters. Poor baselines lead to incorrect conclusions. You'll either chase phantom problems or miss real ones.
Real Example: Monitoring Bottle Fill Levels
Let's walk through a concrete example. You run a bottling line that's supposed to fill bottles with 500ml of liquid. Too little and you're cheating customers. Too much and you're losing money.
Your process runs smoothly with a standard deviation of 3ml when everything's working correctly. You decide to sample 25 bottles every hour.
The standard error for your sample means is: SE = 3 / √25 = 0.6ml
Your control limits at 3 standard deviations are:
- Upper: 500 + (3 × 0.6) = 501.8ml
- Lower: 500 - (3 × 0.6) = 498.2ml
At 10am, you sample 25 bottles. Their average fill is 501.9ml. This exceeds your upper control limit. You calculate the z-score:
z = (501.9 - 500) / 0.6 = 3.17
This corresponds to a p-value of about 0.002. There's only a 0.2% chance of seeing this by random variation. Something's wrong.
You investigate and find that a pump valve is slightly stuck open, causing overfilling. You fix it, and the next sample comes back at 500.1ml. Crisis averted before you wasted thousands of bottles.
Common Quality Control Scenarios
Z-tests apply to many manufacturing situations:
Weight checks: Food packaging, chemical batches, and bulk materials need consistent weights. Sample products, weigh them, and run z-tests against target weights.
Dimensional measurements: Length, width, height, diameter, and thickness all matter. Machine parts must fit together. Sample products and check dimensions.
Strength testing: Materials need specific tensile strength, pressure resistance, or load capacity. Destructive testing samples tells you if the batch meets specs.
Chemical composition: Pharmaceuticals, alloys, and formulations require precise ingredient ratios. Sample batches and analyze composition.
Temperature monitoring: Many processes depend on maintaining specific temperatures. Log temperatures and check if they deviate from targets.
Time measurements: Curing times, cycle times, and processing durations affect quality. Monitor these and flag unusual values.
The principle stays the same across applications: sample regularly, calculate z-scores, and act on significant deviations.
One-Sided vs. Two-Sided Tests
In quality control, you need to think about whether deviations in one direction are worse than the other.
Two-sided tests flag values that are either too high or too low. Use these when both directions cause problems. Bolts that are too long or too short both fail to fit properly.
One-sided tests only care about deviations in one direction. Use these when only one extreme matters. If you're testing product strength, you only care if it's too weak, not too strong. Or if you're checking for contamination levels, you only care if they're too high.
One-sided tests are more powerful for detecting problems in their direction of concern because you're not splitting your significance level. Your control limit is at 1.645 standard deviations (for 95% confidence) instead of 1.96.
Choose the approach that matches your quality requirements. Many manufacturers default to two-sided tests for safety, but one-sided makes sense when appropriate.
Interpreting Results and Taking Action
When a z-test flags a problem, what do you do?
Don't panic. About 0.3% of samples will fall outside 3-sigma limits just by chance, even when nothing's wrong. One flagged sample isn't necessarily an emergency.
Look for patterns. One point just beyond the limit might be noise. Multiple points trending toward a limit signal a real shift. Seven consecutive points on one side of the center line (even within limits) also suggest something's changing.
Investigate immediately. Check equipment settings, inspect recent maintenance, talk to operators, review material batches. Find the assignable cause.
Document everything. Record when problems occurred, what caused them, and how you fixed them. This builds institutional knowledge.
Adjust only when necessary. Don't tinker with a process that's in control. Overadjustment creates more variation, not less.
The goal is responding to real problems while avoiding knee-jerk reactions to random noise.
Advanced Control Chart Rules
Beyond simple control limits, quality engineers use additional rules to catch problems early:
Run rules: Seven or more consecutive points on one side of the center line suggest the process mean has shifted, even if all points are within control limits.
Trend rules: Six or more consecutive points steadily increasing or decreasing indicate a trend that will eventually cause problems.
Zone rules: Divide the area between control limits into zones. Certain patterns of points in different zones signal non-random variation.
Sudden jumps: A point that jumps far from previous points, even if within limits, deserves investigation.
These rules increase sensitivity to subtle changes. An Online Z test Calculator can help you quickly evaluate whether specific measurements trigger any of these conditions.
Sample Size Considerations
How many items should you sample each time?
Larger samples give more precise estimates of the process mean. They reduce your standard error, which makes your control limits tighter and helps you catch smaller shifts.
But larger samples cost more in time and materials, especially with destructive testing.
Common sample sizes in manufacturing range from 4 to 25 items. Smaller operations might use 4 or 5. High-volume production lines might use 20 or 30.
The key is consistency. Whatever sample size you choose, stick with it. Changing sample sizes means recalculating control limits and losing continuity in your charts.
If you're not sure where to start, 5 samples is a practical default for many processes. It's large enough to be meaningful but small enough to be practical.
Frequency of Sampling
How often should you sample?
High-risk processes: Sample every batch or even continuously with automated systems. Pharmaceuticals, food safety, and aerospace parts demand constant vigilance.
Stable processes: Sample once per shift or once per day. Well-established production lines with good track records need less frequent checks.
New processes: Sample frequently until you're confident they're stable, then back off to less frequent monitoring.
After maintenance: Increase sampling frequency after equipment repairs, adjustments, or changeovers until the process stabilizes.
Cost considerations: Balance the cost of sampling against the cost of defects. Missing a problem costs more than checking samples.
Start conservative with frequent sampling. As you build confidence in your process stability, you can reduce frequency.
When to Recalculate Control Limits
Control limits aren't set in stone. You need to recalculate them when:
Process improvements: You've made changes that reduce variation. New limits reflect your improved capability.
Equipment changes: New machines or tools have different characteristics. Old limits no longer apply.
Material changes: Different suppliers or raw materials affect your process variation.
Product changes: Modified specifications require new targets and limits.
Seasonal effects: Some processes vary with temperature, humidity, or other seasonal factors.
Always collect fresh baseline data under the new conditions. Never just adjust limits based on what you think should happen.
Connecting Z-Tests to Process Capability
Z-tests tell you if your process is in control, meaning it's running consistently. Process capability tells you if your controlled process actually meets specifications.
A process can be in control but still produce defects if your natural variation is too large for your specifications. Capability indices like Cp and Cpk quantify this.
These indices compare your process variation to your specification limits. They tell you how much room you have between your actual performance and your limits.
Z-scores play into this calculation. A Six Sigma process (6 standard deviations between the mean and nearest specification limit) has a z-score of 6, meaning defects are incredibly rare.
Most manufacturers aim for at least 3-sigma capability (Cpk ≥ 1.0). Better performers target 4-sigma or 5-sigma. World-class operations achieve 6-sigma.
Real-World Challenges
Quality control with z-tests isn't always straightforward. You'll encounter obstacles:
Non-normal distributions: Z-tests assume normality. If your data is highly skewed, you might need transformations or different tests.
Autocorrelation: When consecutive measurements aren't independent (common in continuous processes), standard control charts can give false signals.
Small shifts: Z-tests might not catch very small but cumulative problems. CUSUM and EWMA charts supplement traditional control charts for this reason.
Operator resistance: Some workers see quality control as criticism. Get buy-in by explaining how it makes their jobs easier by catching problems early.
Data entry errors: Garbage in, garbage out. Automated data collection reduces this risk.
Recognize these challenges and plan for them. No system is perfect, but awareness helps you adapt.
Automation and Modern Quality Control
Technology has transformed quality control. Automated measurement systems, real-time data collection, and computerized analysis make z-tests faster and more reliable.
Sensors measure products continuously without human intervention. Software calculates z-scores instantly and alerts operators to problems. Databases track trends over weeks and months.
This doesn't eliminate the need for understanding z-tests. You still need to interpret results, investigate root causes, and make decisions. Technology handles the tedious parts so you can focus on problem-solving.
Many modern systems integrate statistical process control with manufacturing execution systems. When a z-test flags an issue, the system can automatically adjust machine settings within predetermined limits or halt production for human review.
Training Your Quality Control Team
Everyone involved in quality control needs proper training:
Operators need to know how to collect samples properly, use measurement equipment correctly, and when to flag issues.
Supervisors need to understand control charts, interpret z-scores, and lead investigations when problems arise.
Engineers need deep knowledge of statistical methods, process capability, and root cause analysis.
Management needs enough understanding to support the system, allocate resources, and make informed decisions.
Don't assume statistical knowledge. Many capable workers haven't studied statistics since high school, if ever. Provide clear, practical training focused on what they need for their specific roles.
Regular refresher training keeps skills sharp and prevents drift in procedures.
Cost-Benefit Analysis
Quality control costs money. Sampling takes time. Equipment needs calibration. Software requires investment. Training consumes resources.
But the benefits far outweigh the costs:
Reduced waste: Catching problems early means fewer defective products reach customers or even leave the production line.
Lower rework costs: Fixing problems in-process is cheaper than fixing finished products or handling returns.
Better customer satisfaction: Consistent quality builds trust and repeat business.
Regulatory compliance: Many industries require documented quality control. Z-tests provide objective evidence.
Process knowledge: Data collected for quality control reveals opportunities for improvement.
A good quality control system pays for itself many times over through defect reduction alone.
Wrapping It Up
Z-tests give manufacturers a powerful tool for maintaining production standards. They turn subjective quality judgments into objective decisions based on data.
Set up proper baselines, sample consistently, calculate z-scores, and act on significant deviations. That's the formula for catching problems before they become expensive disasters.
Control charts make z-tests visual and actionable. Your team can see at a glance whether production is running smoothly or needs attention.
The investment in statistical quality control pays off through reduced waste, happier customers, and smoother operations. It's not optional in modern manufacturing. It's how you stay competitive.
Frequently Asked Questions
How is a z-test different from a t-test in quality control?
Z-tests work when you know your population standard deviation from long-term process data. T-tests work when you don't know it and must estimate from your sample. In established manufacturing, you usually have historical data, so z-tests are more common. For new processes, use t-tests until you build enough history.
What do I do if my process keeps going out of control?
Persistent out-of-control signals mean your process has fundamental problems. Stop looking at symptoms and find root causes. Is equipment worn? Are operators properly trained? Are materials inconsistent? Are specifications realistic? Fix the underlying issues rather than constantly reacting to symptoms.
Can I use z-tests for attribute data like pass/fail inspection?
Yes, but you'll use z-tests for proportions rather than means. Calculate the proportion of defects in your sample and compare it to your target defect rate. The math differs slightly, but the principle is the same.
How do I set realistic specifications?
Specifications should come from customer requirements or functional needs, not just what your process can achieve. If your process can't meet legitimate specs, you need process improvement. If specs are tighter than necessary, consider whether relaxing them makes sense.
What's the difference between control limits and specification limits?
Control limits describe what your process naturally does (voice of the process). Specification limits describe what your product must do (voice of the customer). A process can be in statistical control but still produce out-of-spec products if your process variation is too large.
How do I handle multiple characteristics on the same product?
Create separate control charts for each critical characteristic. Trying to combine them loses information. If many characteristics need monitoring, focus on the vital few that most impact quality. Or use multivariate control charts for related characteristics.